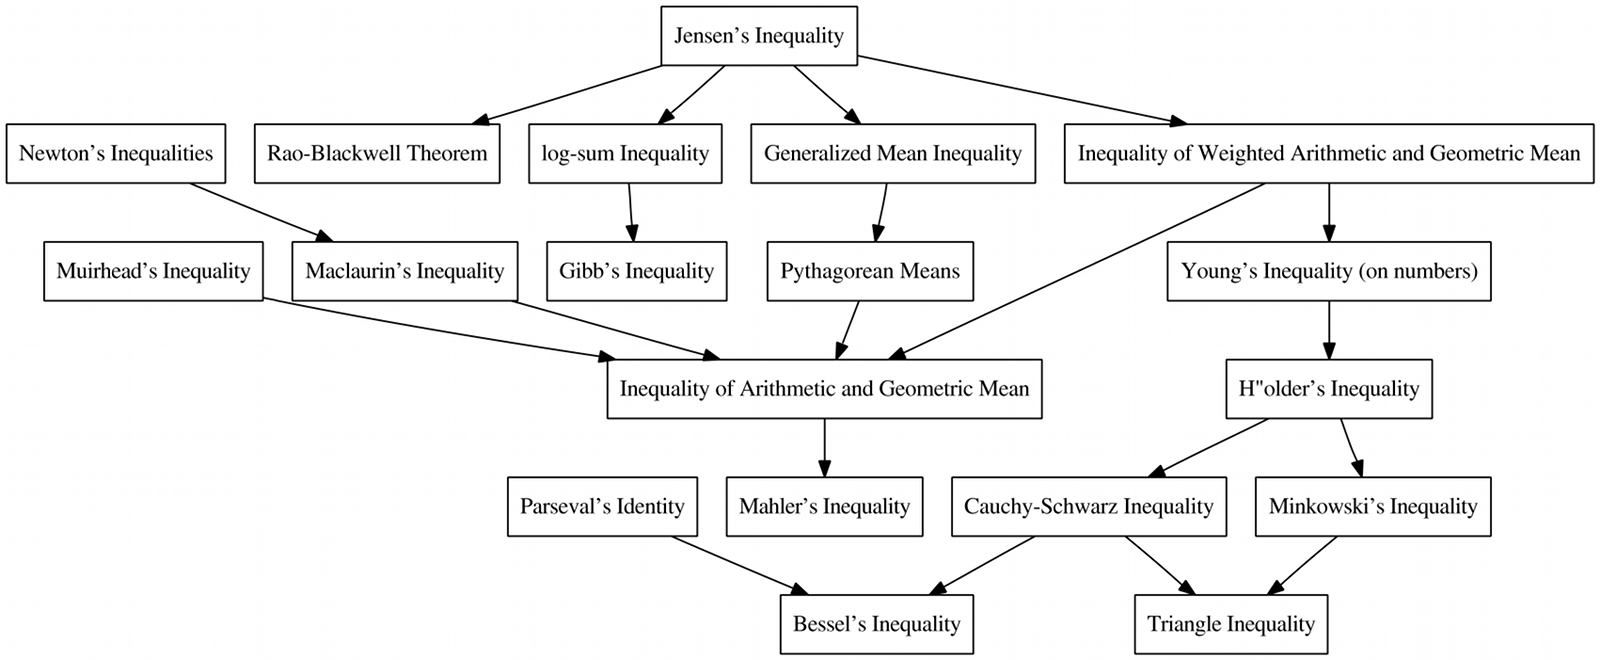
Inspired by a tweet, I decided to play a bit with Graphviz to create a graph on which inequalities imply which ones. Here’s the result:

Click here to obtain a larger version. Click any box on the image to obtain the Wikipedia page on the inequality.
Inspired by a tweet, I decided to play a bit with Graphviz to create a graph on which inequalities imply which ones. Here’s the result:
Click here to obtain a larger version. Click any box on the image to obtain the Wikipedia page on the inequality.
2009 (16)
| |||||||||||||||||||||||||||
2010 (8)
| |||||||||||||||||||||||||||
2011 (3)
| |||||||||||||||||||||||||||
2012 (3)
| |||||||||||||||||||||||||||
Comments.
Nice idea!
But instead of providing a higher resolution bitmap version, you should publish the .dot source file instead. With it, everyone can create a even bigger one – one other formats like .svg.
I'd happily provide the .dot file, but unfortunately I cannot find the source files anymore... If I happen to find them again, I'll put them online.
I understand—anyhow, thanks for your rapid response!